
Base Maps Service
We have been building digital maps and using GIS and CAD since 1995 and have made literally thousands of base maps over those 30+ years.
Let us do the hard work of making maps of your project that only the world’s leading farm planning organisation knows are what you need and at a price that you can afford.
LAYERS
Depending on the project, our base map package includes roughly 90-130 outputs of the following 20 layers:
Contour Maps * .
Relief Maps *
Slope Maps * †
Height Map * †
Polyhedral Map
Landforms Maps * †
Morphometry Maps * †
Erosion Risk Map * †
Relative Valley Depth Map * †
Wind Exposure Map * †
Aspect Map †
Hillshade Map
Viewshed Map * †
Drainage Network Map
Topographic Wetness Index Maps *
Watershed Maps *
Inundation Map *
Flow Velocity Map * †
Land Capability Assessment * † (Australia only, US coming soon)
Digital Terrain Model * - For your future reference and for accountability purposes, we will also provide you the DTM files we have generated. They will come in up to 3 variants - including of the larger context, the area of interest, and the cadastral boundary.
* These layers come in several variations with different levels of detail, style, and/or extent.
† These layers include an accompanying legend/appendix.
We will be gradually introducing more layers!
PRICE
We firmly believe that quality maps should be affordable for everyone involved in land stewardship. Where others charge hundreds of dollars for a low resolution contour map or thousands of dollars for a similar but inferior package, we provide all of this at an unbeatable, industry leading price of just USD$100 for areas up to 5000 Ha!
For processing of areas above 5000 Ha, contact us in advance for a quotation. Large areas of high resolution data may have to be split into tiles, effectively requiring more than one set of basemaps to be processed. The cost will be based on this formula: Ha * 0.02 (e.g. an area of 6000 Ha will cost USD$120).
Large discounts (20-50%) also apply for those who are currently paying members (have an active subscription) to one of our planning packages. Expired subscriptions/old memberships do not apply.
Furthermore, if you can find a better deal elsewhere, send us a message with proof and we’ll do the service for you for free.
PROCESS
Order - Complete the ‘Base Map Form’ (button below) and upload your project boundary files. Its easy - download Google Earth Pro and then make and send us a project boundary area file as a Google Earth .kml or .kmz
Payment - Use the ‘Pay Here’ button on the form page to get the process started.
Data Availability - Not all places have free publically available high resolution elevation data. This data is mostly limited to the USA, Australia, Aotearoa/NZ and parts of the EU, with pockets of it available in other countries (e.g. Canada). We will always prioritise using this data if it’s available in order to not add cost onto the service fee by having to procure it for a fee.
However, if no freely available high-res data is accessible for your area of interest, we will contact you and present alternatives - e.g. you can supply the data via drone capure (which we can also process for you), ground survey, or other means; or we can obtain the data through our partners. We have secured instant turnaround for 5 meter global coverage for ~11-15$ / km2. We also have access to higher resolutions of up to 20 cm / px depending on the region, but that data is subject to quotation and usually a longer turnaround. If you are not satisfied with the extra cost and do not wish to proceed, then you can simply let us know and we will provide a full refund as usual.
If your project is not within the above listed regions, then please fill out the 'Base Map Form' first without paying and we'll see what's available for the area and present you with options before you have to pay anything.Turnaround - Typically 1-7 working days, depending on data availability. You will receive the maps via Google Drive directly on the email you made the order through. Please make sure to check your spam folder. Many of the layers will come in several variants with different levels of detail and extent. Almost all of the maps will be provided in GeoTIFF and in KMZ for each layer, except certain layers which are entirely vector (e.g. Contours) which come only in KMZ. The accompanying legends for the various layers will also be included in the KMZ folder.
Refunds - If we can’t access the required DEM data that we need or if we cannot complete the service for any other reason within the specified time frame (e.g. due to illness, backlog, or being away) then we will provide you with a full refund.
Regrarians Base Map Layers
*While a ‘…map is not the territory…” (Alfred Korzybski, 1931), in the 9 decades since that famous statement was made, with the technology now available to map the earth and the mapping software used to analyse it, its not uncommon for a map to have the resolution of your actual footprint.
With that in mind please check out examples of the various map layers included in the Regrarians Base Maps package

Contour Map
Topographic contours are a core necessity when it comes to integrated land planning. We will create several variants of contour outputs for you, e.g 0.5m, 1m, 2m, 5m (or in imperial units if requested). To preserve accuracy, and unless otherwise requested, we will generally limit the contour interval to the resolution supported by the digital elevation model e.g. 1m/pixel DEM = 1m contour interval. We also index the contours, i.e. highlight ‘major’ and ‘minor’ contours for easier recognition. Moreover, the outputs will be cleaned from noise and artifacts, and optimized.

Shaded Relief Map
A lot of people are unfamiliar with reading topographic contour maps and these ‘3D 2D’ maps make it a lot easier to see the topo lines in a whole different light. The point of this output isn’t to be realistic but rather to be illustrative and useful for presentation purposes.

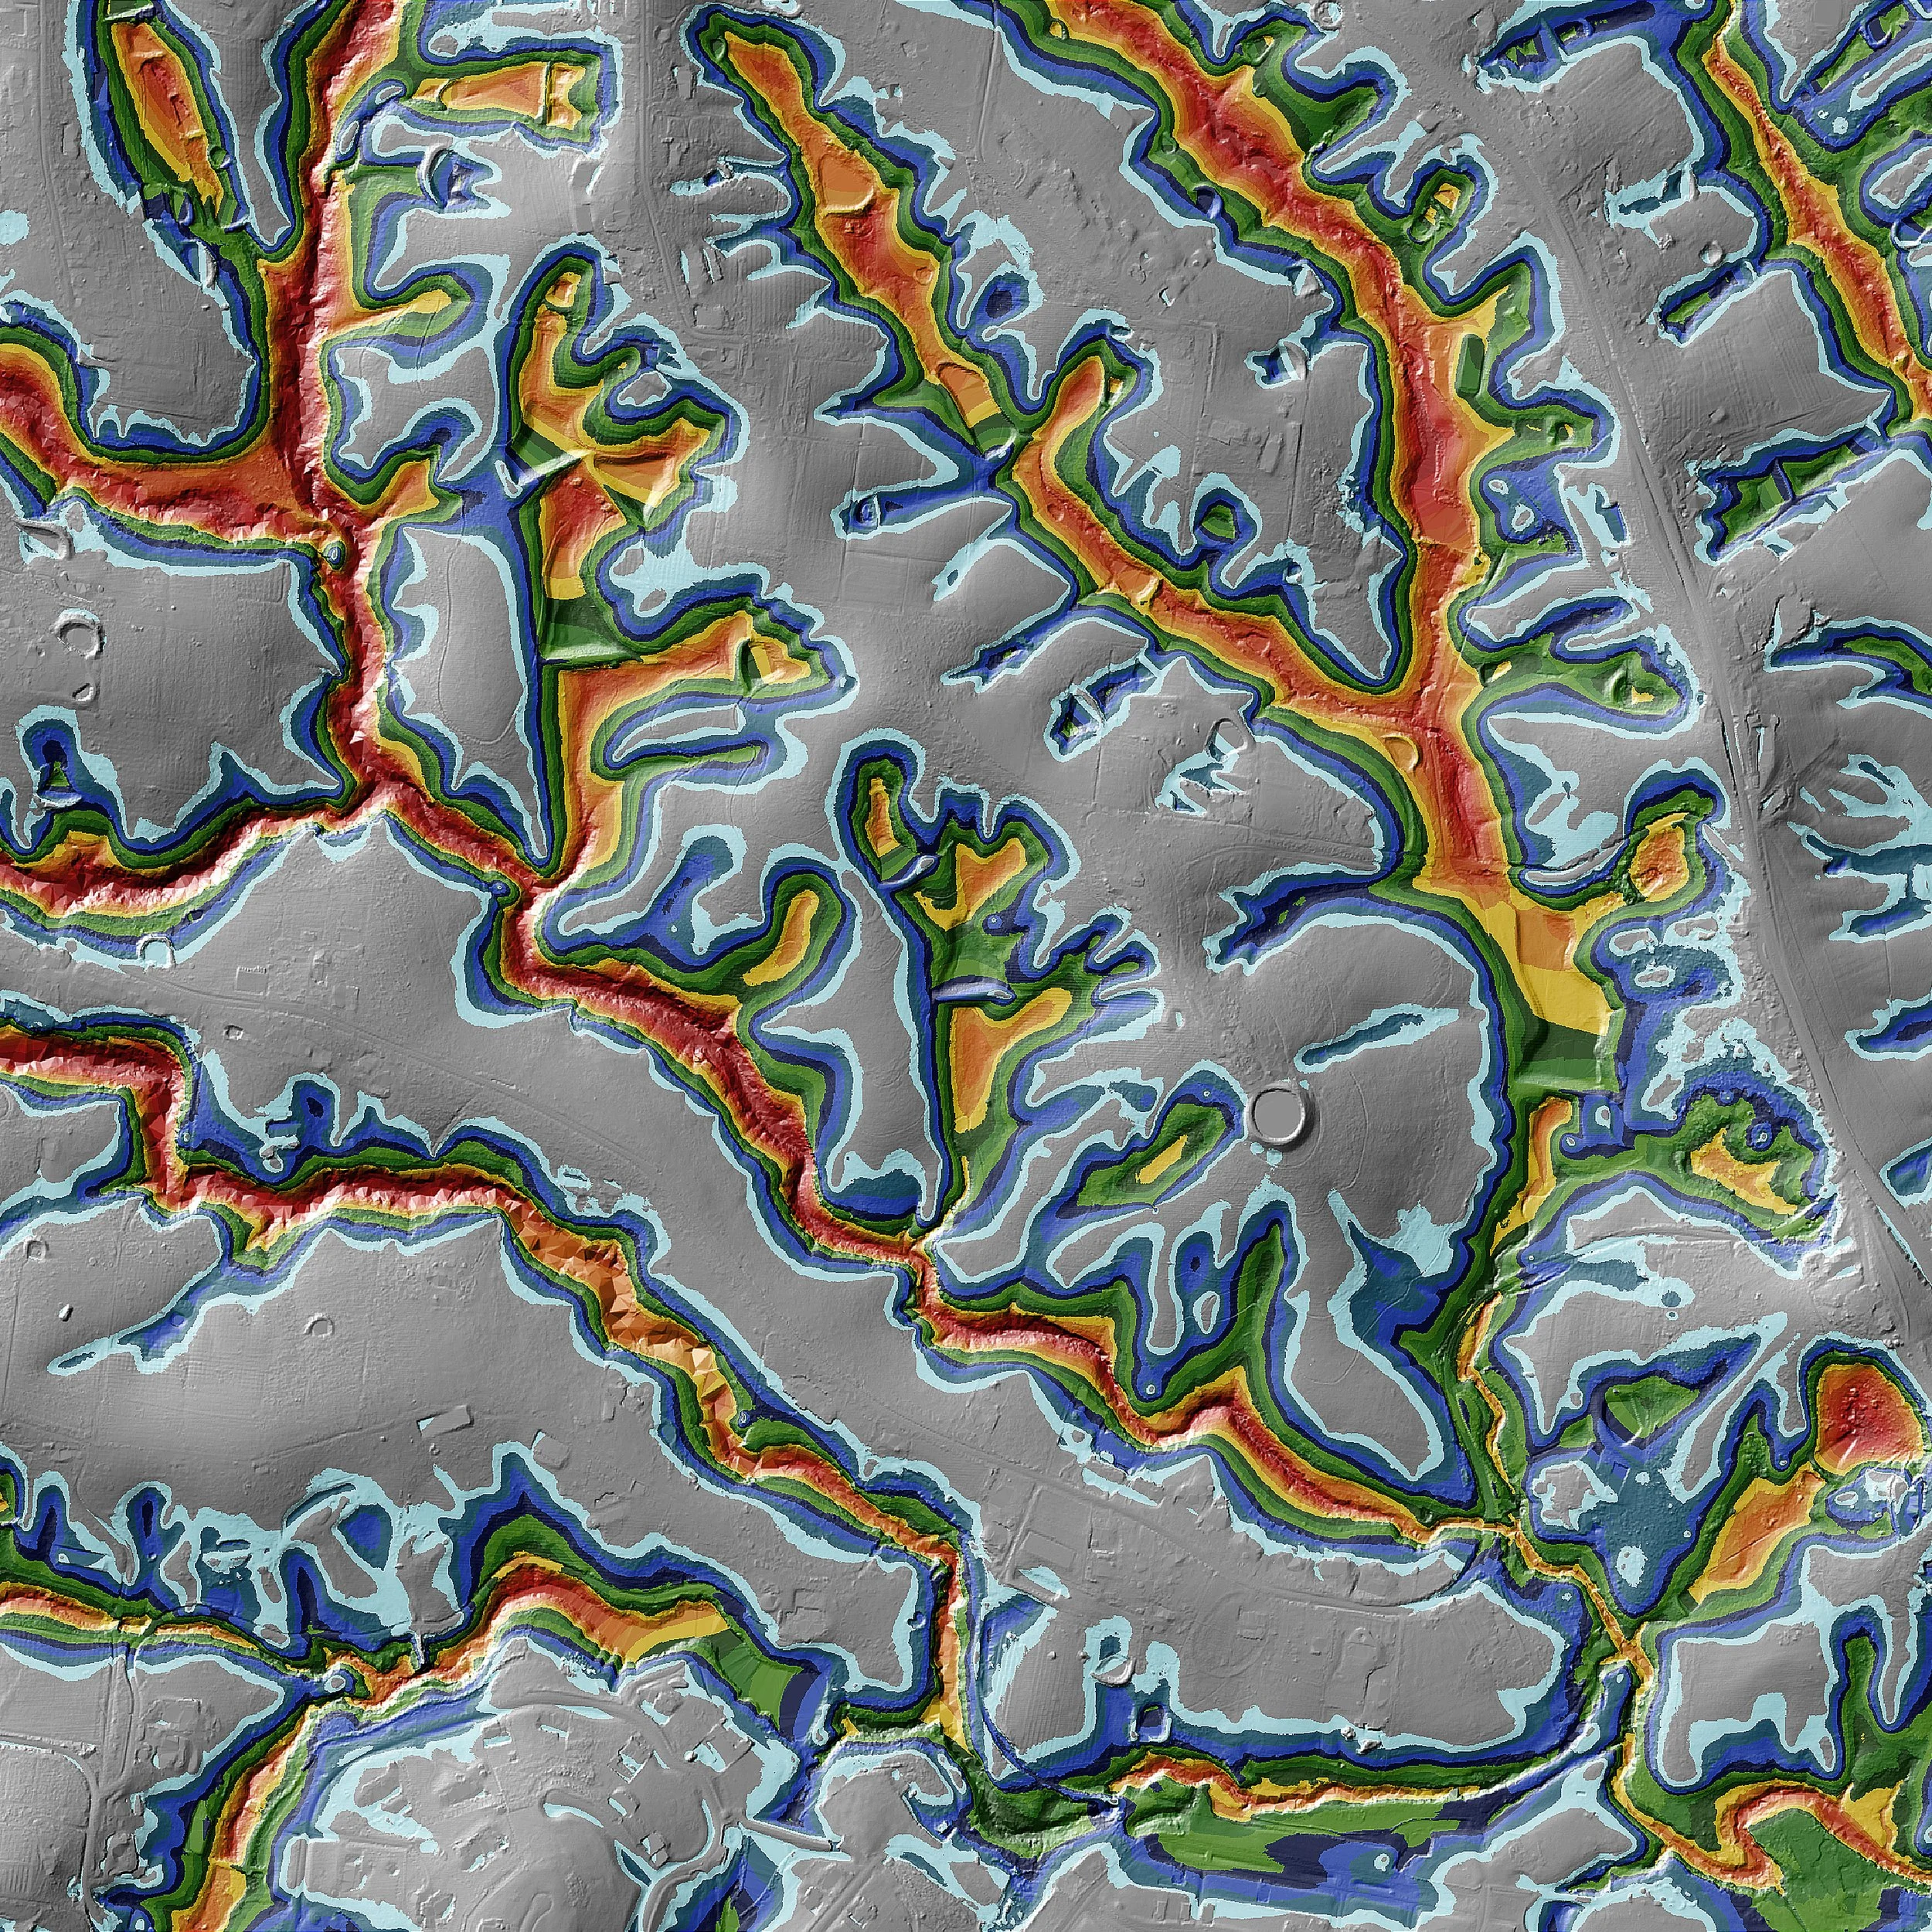
Slope ‘Heat’ Map
So much of what you can do on a landscape relates to its slope and so its an important map layer—especially for those of you with projects on hilly sites. This slope ‘heat’ map layer is a ‘whole’ map which indicates the slopes across the entire project area and has an extended legend which provides additional land-use advice and cautions based on our considerable experience.

Slope ‘Ranges’ Map
This layer is effectively the same as the slope layer above with one difference - you have can switch on/off each of the slope ranges. For example, you can see just the 8-10 degree range. This is incredibly useful in the way it can provide key insights. For example, we first developed this method so we could easily identify areas where earthmoving became less efficient. Its also useful for establishing which areas are too steep for roads or for operating machinery on a side slope (e.g. tractors running on the contour or Keyline)

Height Map
Sometimes called an ‘elevation’ map, this is another layer which is meant to help people who struggle with reading topographic contour maps. Its also great to quickly identify high and low areas across a project or areas of similar elevation.

Landforms Map
This output helps identify the various landform elements across a site - e.g. main ridges, flat areas, primary ridges, convex slopes, depressions, valleys, etc. It comes in few variants with different levels of detail. A legend is also provided to help you with interpretation.

Hillshade Map
Also called ‘shaded relief’ maps, this grayscale layer is also provided to help people read the shape and form of a landscape. As these maps are all ‘layers’, you can easily turn this hillshade map on with the topo layer as another way of improving your understanding of contour lines. It is a highly versatile output that you can use as a backdrop to just about any of the other layers to give them more definition.

Polyhedral Map
This custom layer is similar to the Hillshade layer except that it is 3D rendered with surface displacement and ambient occlusion in order to reveal even the smallest features and details present within the available resolution of the underlying elevation data. Hidden structures and terrain characteristics otherwise unseen now stand out in stark contrast.

Morphometry Map
This unique custom made map helps outline landscape elements, similarly to the Landforms output but with more focus on identifying convex and concave shapes, and the transition between them. It can be incredibly useful in quickly spotting areas of opportunity - for cropping, building, earthworks, and more.

Aspect Map
Solar orientation is a major consideration in production landscape design, construction and even earthworks. The aspect map will clearly highlight the solar orientation of landscape elements. It comes with an easy to read legend for both northern and southern hemispheres.

Erosion Risk
Our algorithm will survey the watershed within the bare terrain model for potential erosion risk and highlight areas for consideration. While surface features like vegetation are not accounted for, the output can still provide useful insight in decision making when prioritizing areas for erosion management.

Wind Exposure Map
This map layer indicates the general degree of wind exposure for any point in the landscape. A legend is included to help with the assessment. We can also prepare a site specific wind exposure output based on the prevalent wind direction(s) for your site, should you have that data available.
Relative Valley Depth
This output will provide you insight into the relative depth of valleys on the site - useful for identifying potential dam sites, biodiversity corridors, road crossing sites, etc.

Viewshed Map
This map layer highlights the extent to which one can see in the distance from any point in the landscape before detecting a terrain obstacle. It can help identify vistas, scenic spots, etc. Detailed legend is provided.

Drainage Network Map
This output highlights the general drainage network and flow accumulation across the site. It comes in vector form, i.e. lines of varying width depending on the degree of flow accumulation - this makes it easy to overlay onto other layers.

Land Capability Assessment
At this stage only available for some projects in Australia, this map layer uses this well-established form of reference to determine a landscape’s capability to support various land-uses. A highly detailed legend is included to help with interpretation.

Topographic Wetness Index Map
This map layer indicates where water may be subject to periodic inundation and flooding—another useful form of analysis for planning where to place specific elements (or not) or engage in certain land uses (or not) in your planning and management decision making. We will prepare this layer in several variants with different levels of detail.

Flow Velocity Map
This map highlights areas that have the potential for increasingly high runoff velocity and thereby potential for exponentially more severe erosion than other areas.

Inundation Map
This map layer outlines pockets of inundation across the site. Naturally it will capture elements like dams, ponds, ditches, pits, etc.; basically any structure - natural or man made - which potentially impounds water.

Watershed Map
This output highlights the various watersheds across the site. We will provide this layer in several variants - each highlighting watersheds of different scales, including micro, small, medium, large and extra large. We supply this layer as a raster and as a vector, with area size already embedded within each of the catchment outlines.

Disclaimer
While all of the maps developed using the Regrarians Base Map Service are of as high a quality as we can make them, they are indeed ‘not the territory’ and this needs to be understood and respected.
We strongly advise people to apply the appropriate due diligence when engaging in any land use decisions and to this end, consider using surveys which have been captured and developed by licenced surveyors and engineers.
Accordingly Regrarians Ltd. & HeenanDoherty Pty. Ltd. and its contractors are not accountable for the maps and/or data provided and cannot guarantee that they are accurate, correct or comprehensive.
A Homage
‘Nevallan’ is the site that we have used for the demonstration layers above. This site remains the only in-tact project that the late, great P.A. Yeomans developed from the 1940’s to when he was forced to sell this to pay ‘death duties’ following the loss of Mrs. Rita Yeomans in 1964. Hopefully ‘Nevallan’ doesn’t suffer the same fate as the neighbouring ‘Yobarnie’ did in recent years where it has been developed as a housing estate with a relatively minor amount of heritage-listed farming land. We offer this homage to Mr. Yeomans and his son’s Neville (†), Allan (†) and Ken’s significant influence on our work in this space and for Allan and Ken’s support and friendship over more than 3 decades.
Membership Packages
30+ years of experience in working with ten’s of thousands of people and their projects have taught us that successful farm planning is the result of a longitudinal process that integrates education and extension. We have developed three membership packages which provide you with different support options. If these are not a good fit for you then you can work pro rata within our using trading conditions.

Discovery
Start your farm planning journey with
access to key resources
$10/month*
Regrarians Workspace - FREE
Regrarians eHandbook - 10% OFF
Regrarians Design & Planning Services - 20% OFF

Planner
Create your own farm plan with the
REX® Farm Planning Program
$95/month*
Regrarians Workspace - FREE
Regrarians eHandbook - FREE
Regrarians Design & Planning Services - 50% OFF
REX® Farm Planning Program - FREE
REX® Farm Planning Program Archives - FREE

Deploy
Retain Regrarians as you develop
what you’ve learned & planned
$60/month*
Regrarians Workspace - FREE
Regrarians eHandbook - FREE
Regrarians Design & Planning Services - 30% OFF
REX® Farm Planning Program Archives - FREE
*All in USD & 12 months minimum - refer to Regrarians Trading Conditions for more information
When you are ready…
Since 1993 we have supported tens of 1000’s of people change their lives, enterprises, practices, landscapes & communities. The hardest step is the first one you take. When you are ready, we are too.